Our products
Nomic gives you the means to transform decades of unstructured data into organised, AI-ready knowledge, and the platform to operationalize it at scale.
Our products
Nomic gives you the means to transform decades of unstructured data into organised, AI-ready knowledge, and the platform to operationalize it at scale.
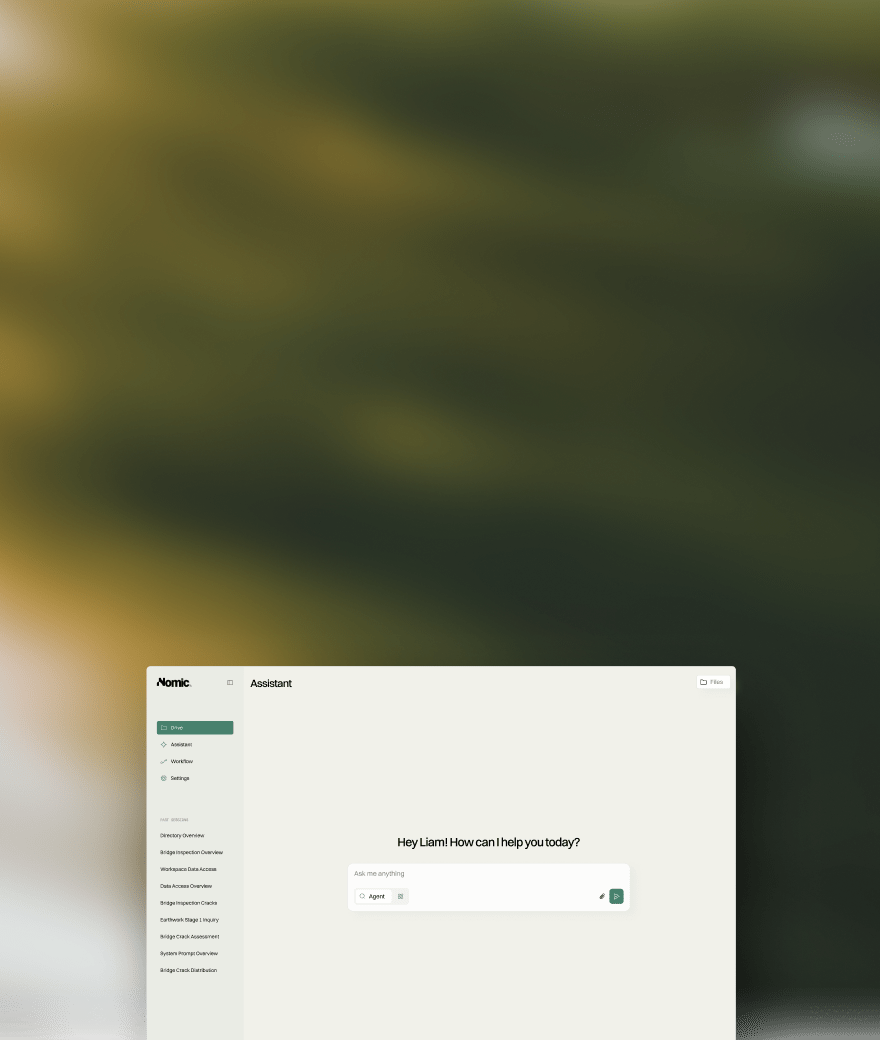
Nomic Platform
A turnkey AI-solution for out-the-box workflows and assistance across your firm's knowledge.
news & Resources
Discover what’s happening at Nomic

NEWS
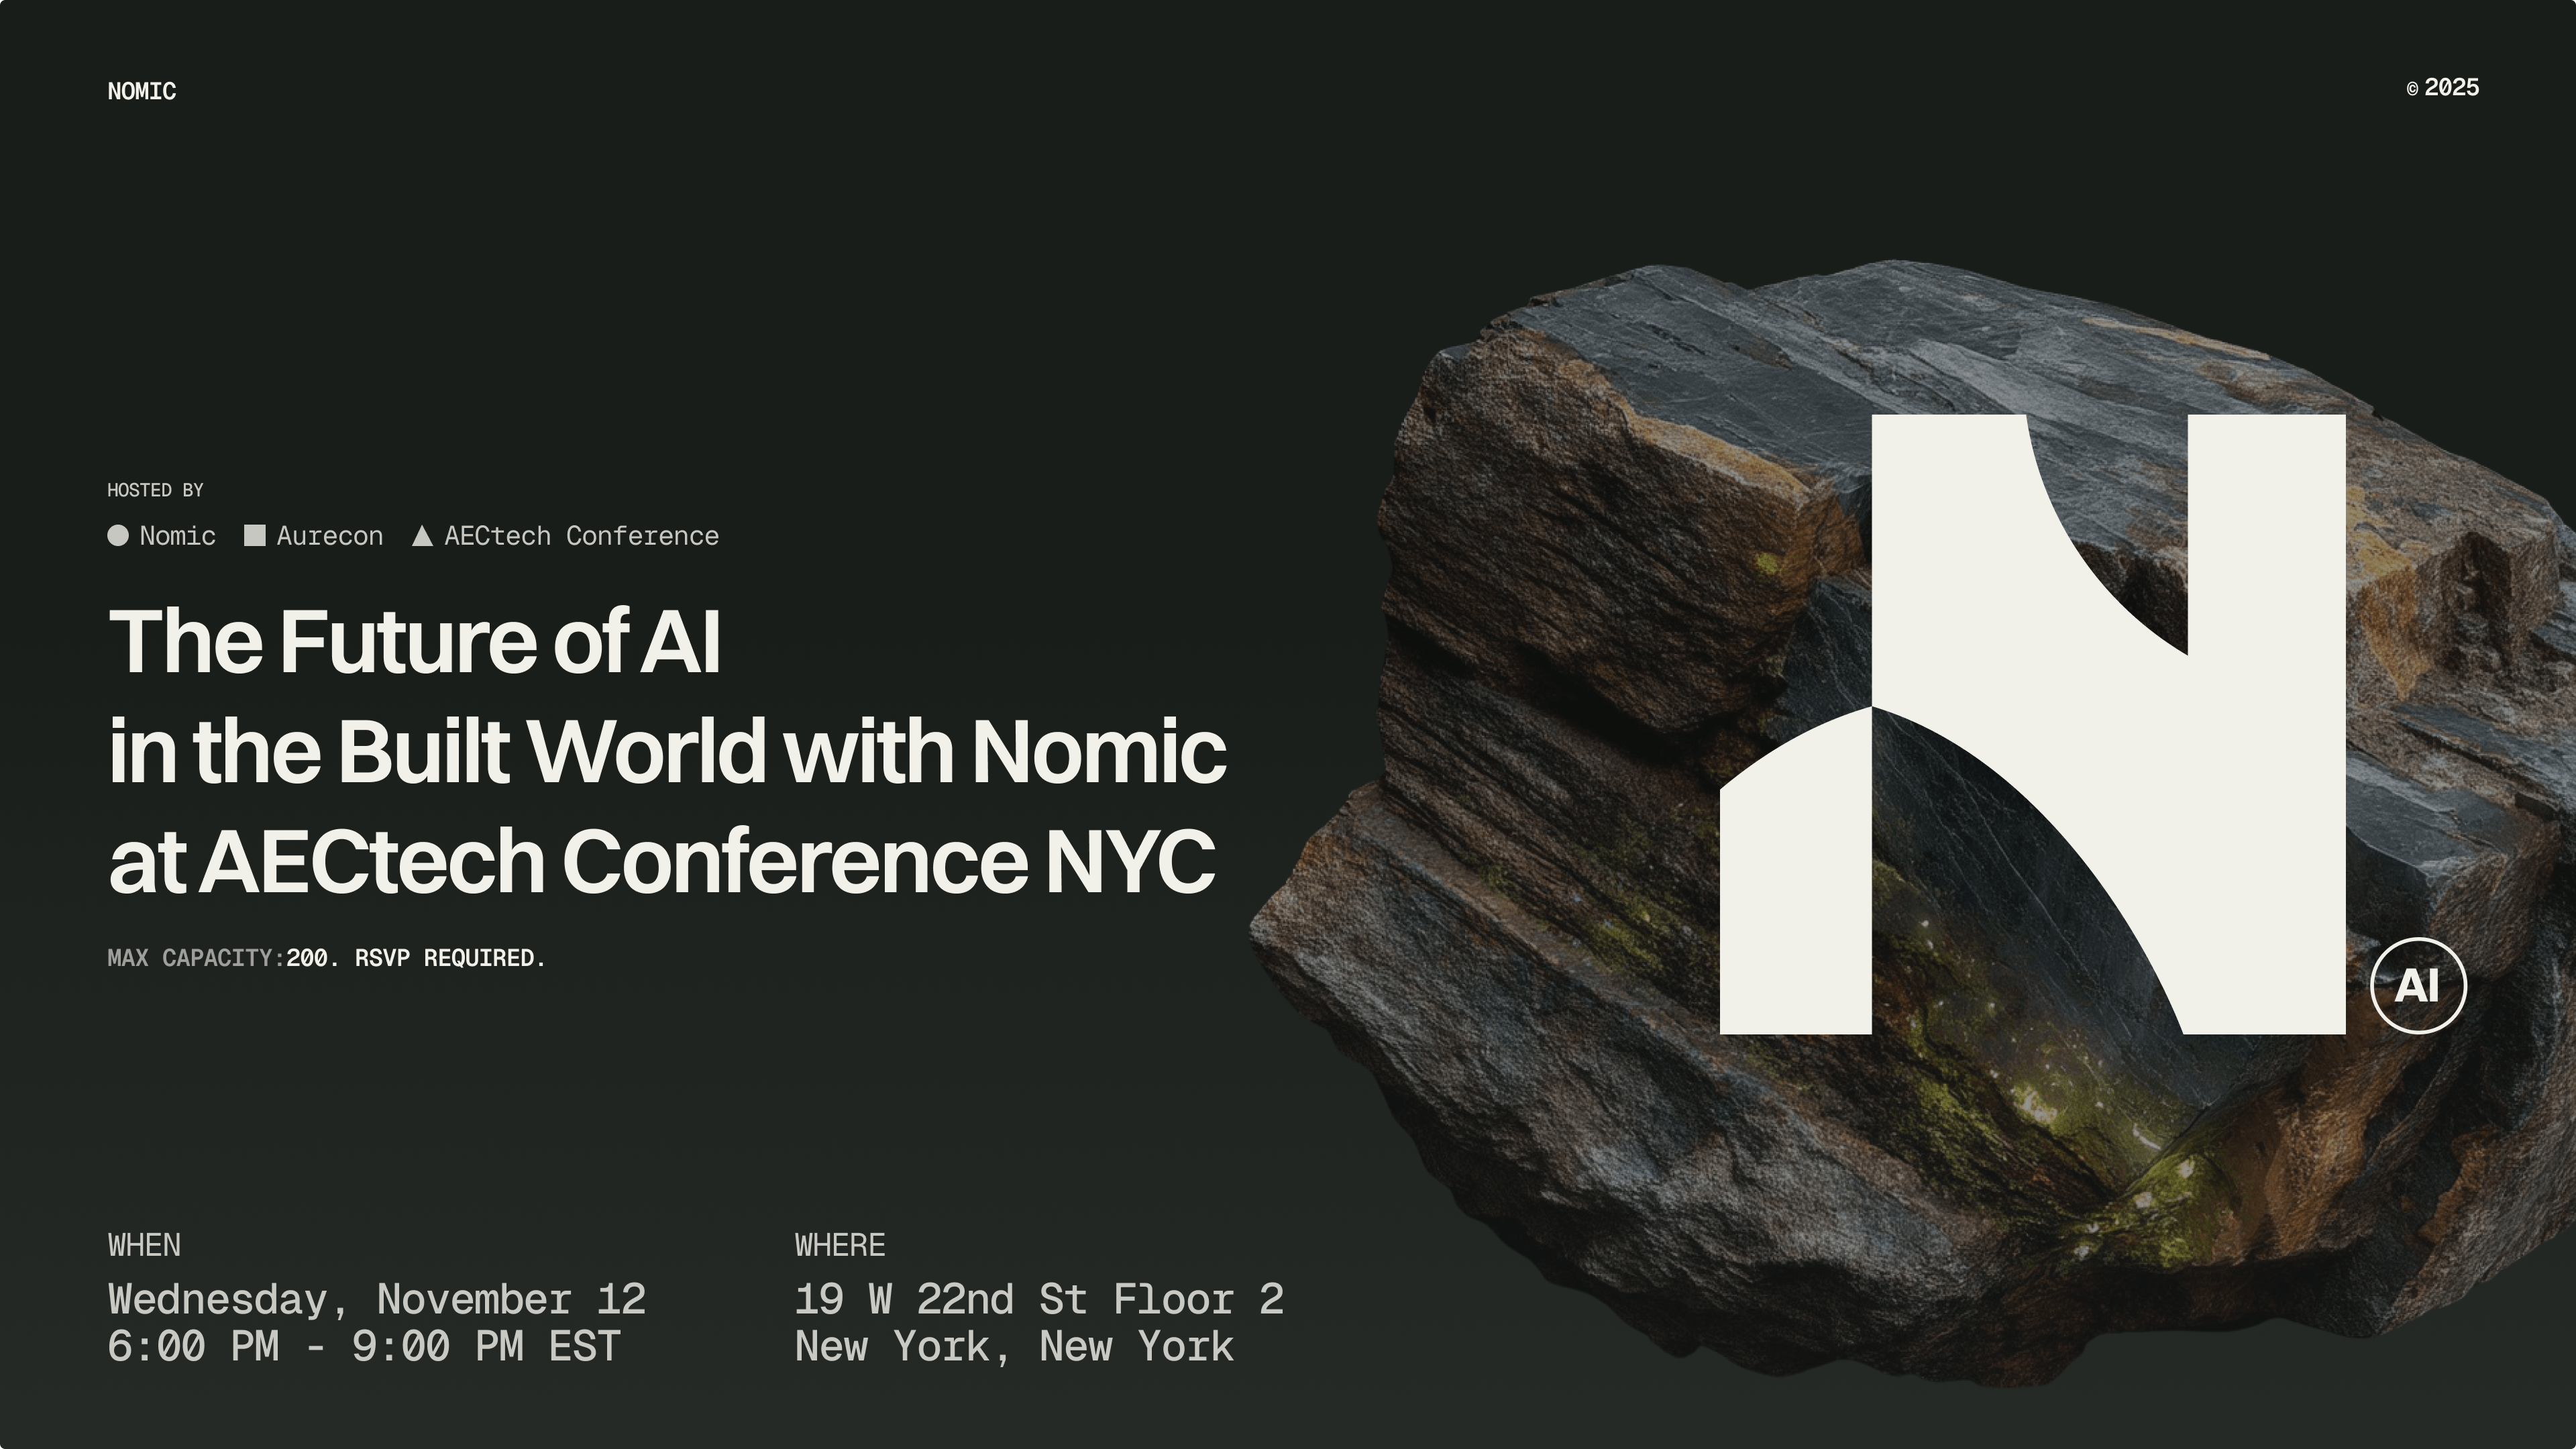
EVENT
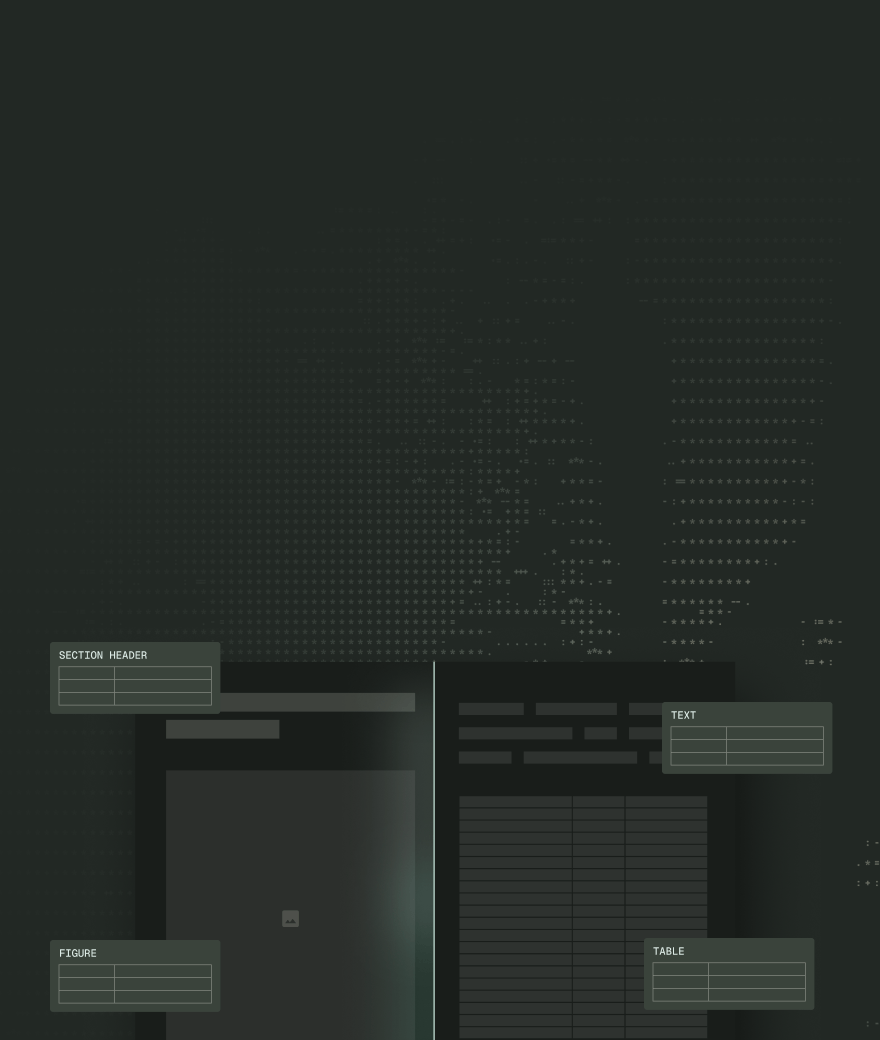
WHITE PAPER
November 12th, 2025
NYC
The Future of AI in the Built World with Nomic: AEC Tech Conference NYC

NEWS
EVENT
WHITE PAPER
April 2, 2025