


SmartPM
SmartPM seamlessly integrates with your existing CPM scheduling software, providing Automated Project Controls™ that reduce costly delays, overruns, and disputes on your commercial construction projects.
Definition
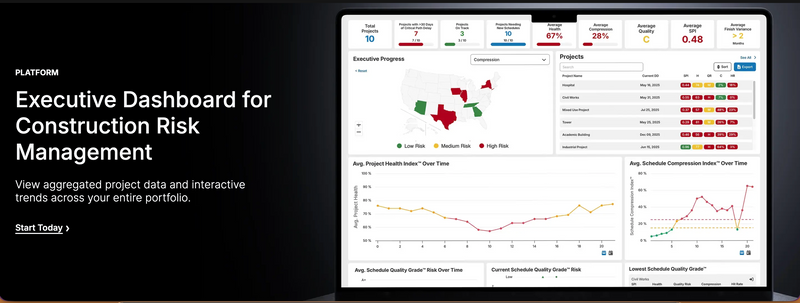
SmartPM’s Executive Dashboard gives construction leaders a real-time, portfolio-level view of project health so they can manage risk before it becomes delay, rework, or claims. Instead of digging through individual schedules and reports, executives get one centralized screen that surfaces trends, issues, and opportunities across every active job. Built on SmartPM’s Schedule Controls™, the Executive Dashboard aggregates schedule data from your entire portfolio and turns it into clear, interactive visuals. See which projects are compressing, where float is eroding, and which jobs are most at risk—all in one place. Use the dashboard to support data-driven decisions in weekly huddles, board updates, and owner meetings. A key feature is interactive portfolio trends. With a few clicks, you can filter projects by region, customer, business unit, contract type, or any other metadata field you track. This lets you compare performance between offices, identify patterns in sched
In Depth
SmartPM provides AI-powered construction schedule analytics. The platform analyzes CPM schedules to identify risks, measure contractor performance, and predict project outcomes.
Tool Details
United States
Examples
This helps uncover systemic issues, such as recurring delays tied to certain project types, partners, or phases of work
Nomic Use Cases
See how Nomic applies this in production AEC workflows:
Frequently Asked Questions
SmartPM’s Executive Dashboard gives construction leaders a real-time, portfolio-level view of project health so they can manage risk before it becomes delay, rework, or claims. Instead of digging through individual schedules and reports, executives get one centralized screen that surfaces trends, issues, and opportunities across every active job. Built on SmartPM’s Schedule Controls™, the Executive Dashboard aggregates schedule data from your entire portfolio and turns it into clear, interactive visuals. See which projects are compressing, where float is eroding, and which jobs are most at risk—all in one place. Use the dashboard to support data-driven decisions in weekly huddles, board updates, and owner meetings. A key feature is interactive portfolio trends. With a few clicks, you can filter projects by region, customer, business unit, contract type, or any other metadata field you track. This lets you compare performance between offices, identify patterns in sched
This helps uncover systemic issues, such as recurring delays tied to certain project types, partners, or phases of work.
Project Research: Instantly access all project-critical information from a single search interface.